ARDUINO ATMOSPHERIC TAPE MEASURE/ MS5611 GY63 GY86 DEMONSTRATION
This is really a barometer/altimeter but you will see the reason for the title by looking at the video.
The MS5611 pressure sensor, found on the Arduino GY63 and GY86 breakout boards, delivers amazing performance. On a calm day it will measure your height to within 0.2m. This is effectively measuring the distance from your head to outer space and subtracting it from the distance of your feet to outer space (by measuring pressure – that is the weight of the air above). This spectacular device has a range that will comfortably measure the height of Everest - and can also measure down to a few inches.
This project was aimed as: a schools project, an example of modifying Arduino code and a good starting place to explore using the MS5611 sensor. There are plenty of forum questions from those having difficulties with this sensor. The approach here makes using it very straightforward. After doing this project you will be well equipped to develop other pressure related applications.
Every sensor has its own calibration constants that need to be read and used to correct the data. There is a library available to help drive these. The code shown here uses the library to take readings and then converts them to height and displays them on a LCD Shield.
First we will send the data to the serial monitor on the PC/laptop for initial tests. These show some noise and so we add a filter to smooth them out. Then we will add a LCD display so the unit can run independently and you can try measuring your height – or anything else.
Note the GY63 board just has the MS5611 pressure sensor. The GY86 is called a 10 degrees of freedom board and also includes a 3 axis accelerometer, 3 axis gyro and a 3 axis magnetometer for just a few $ more.
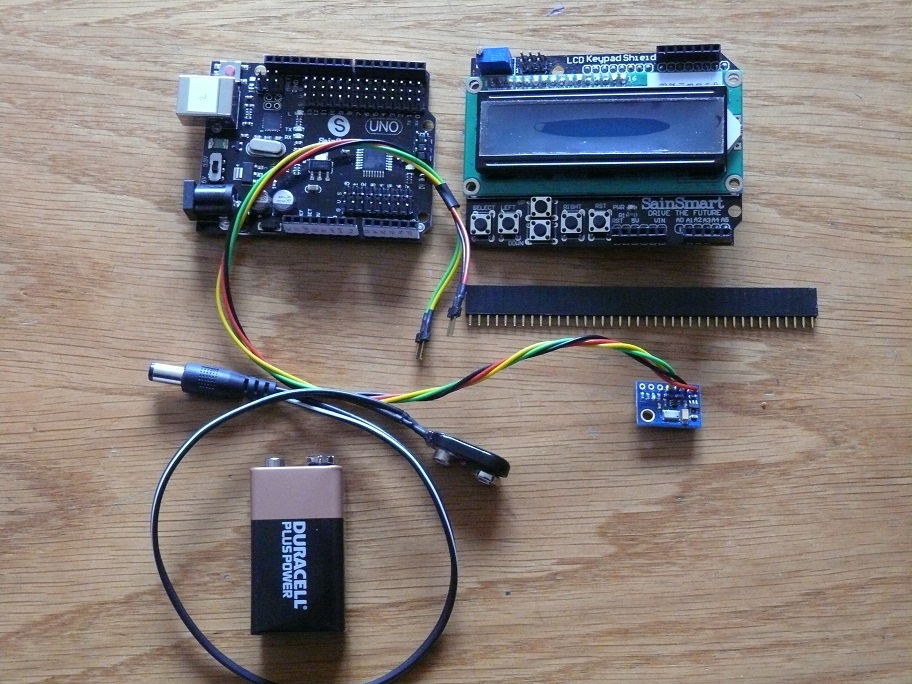
You will need:
1. Arduino UNO (or other with standard pinout) and its USB cable
2. GY63 breakout board or GY86
3. 4 Dupont leads male-female - or connecting wire
4. Arduino LCD keypad shield
5. 9v battery and lead
6. 2.54mm socket strip (optional but recommended)
Preparation
Download the Arduino IDE (integrated development environment) from: https://www.arduino.cc/en/Main/Software
Some technical bits for interest
The MS5611 delivers its great performance by averaging large numbers of measurements. It can make 4096 3 byte (24bit) analogue measurements in just 8ms and give the average value. It has to measure both pressure and temperature so the pressure data can be corrected for internal temperature. Hence it can deliver around 60 pairs of pressure and temperature readings per second.
The data sheet is available at: http://www.te.com/usa-en/plp/ms5611-01ba03/Xoye8B...
Communications is via I2C. So other I2C sensors can share the bus (as is the case on the GY86 10DOF board where all the chips are on I2C).
Get a MS5611 Library
Many of the Arduino sensors either use a standard library that is included with the Arduino IDE or are supplied with a zip file with a library that can be easily installed. This tends not to be the case for the MS5611 sensors. However a search found: https://github.com/gronat/MS5611 that has a library for the MS5611, including performing the temperature correction.
Option 1
Go to the website above, click ‘Clone or Download’ and select ‘Download ZIP’. This should deliver MS5611-master.zip to your downloads directory. Now, if you wish, move it to a folder where you can find it in future. I use a directory called ‘data’ added to my Arduino folders.
Unfortunately the downloaded .zip file not does include any example sketches and it would be nice to add the library and examples to the Arduino IDE. There is a minimum example in the README.md file that can be copied and pasted into a sketch and saved. This is one way to get going.
Option 2
To make it easier to run the code in this instructable I have added the minimum example above and the examples shown here to the library and attached a .zip file below that will install into the Arduino IDE.
Download MS5611-master.zip. Move this to a better folder if you wish.
Start the Arduino IDE. Click Sketch>Include Library>Add zip file and select the file. Restart the IDE. The IDE will now both have the library installed plus all the examples shown here. Check by clicking File>examples>>MS5611-master. Three sketches should be listed.
Connect the Sensor to the Arduino and Test
The GY63/GY86 boards usually come with headers but not soldered. So it is your choice to either solder the headers in place and use male-female Dupont leads, or (as I decided) solder leads directly to the board and add pins to the lead to plug into the Arduino. The latter option is better if you think you might want to solder the board into a project later. The former is better if you want to use the board for experimentation. Unsoldering leads is much easier than a pin header.
The connections required are:
GY63/GY86       Arduino

VCC         -      5v       Power

GND         -      GND      Ground

SCL         -      A5       I2C clock

>SDA        -      A4       I2C data
Attach the sensor board to the Arduino as above and connect the Arduino to the PC/laptop via its USB lead. Also cover the sensor with some opaque/black material. The sensor is sensitive to light (as is the case for most of this type of sensor).
Start the Arduino IDE. Click:
File>examples>>MS5611-master>MS5611data2serial.
A new instance of the IDE will appear with the sketch. Click the upload button (right arrow).
Next start the serial plotter – click Tools>Serial Plotter and if necessary set the baud to 9600. The data being sent is the pressure in Pascals. After a second or so it will re-scale and raising and lowering the sensor by say 0.3m should show as lowering and raising of the trace (lower height is higher pressure).
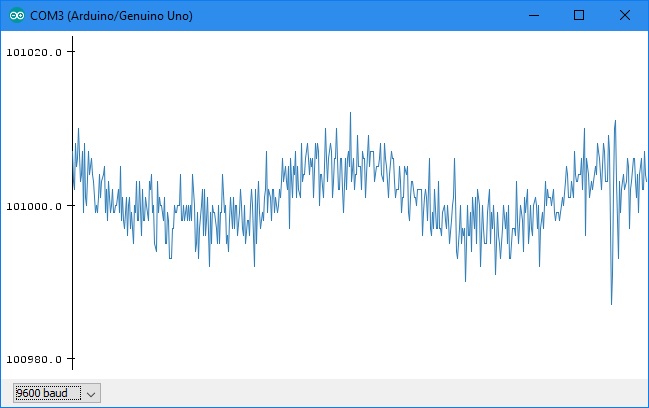
The data has some noise. See first plot above. This can be smoothed using a digital filter (a really useful tool).
The filter equation is:
value = value + K(new-value)
where ‘value’ is the filtered data, and ‘new’ is the latest measured. If K=1 there is no filtering. For lower values of K the data is smoothed with a time constant of T/K where T is the time between samples. Here T is around 17ms so a value of 0.1 gives a time constant of 170ms or around 1/6s.
The filter can be added by:
Add a variable for the filtered data before setup():
float filtered = 0;
Then add the filter equation after the pressure = …. line.
filtered = filtered + 0.1*(pressure-filtered);
It is a good idea to initialise the filtered value to the first reading. So add an ‘if’ statement around the the line above that does this so it looks like:
if(filtered != 0){
filtered = filtered + 0.1*(pressure-filtered);
}
else {
filtered = pressure;          // first reading so set filtered to reading
}
The test ‘!=’ is ‘not equal’. So if ‘filtered’ is not equal to 0 the filter equation is executed but if it is then it is set to the pressure reading.
Lastly we need to change ‘pressure’ to ‘filtered’ in the Serial.println statement so we see the filtered value.
The best learning is achieved by making the changes above manually. However I included these in the example MS5611data2serialWfilter. So if there are problems the example can be loaded.
Now upload the code to the Arduino and see the improvement. See the plot below and note the Y scale is expanded x2.
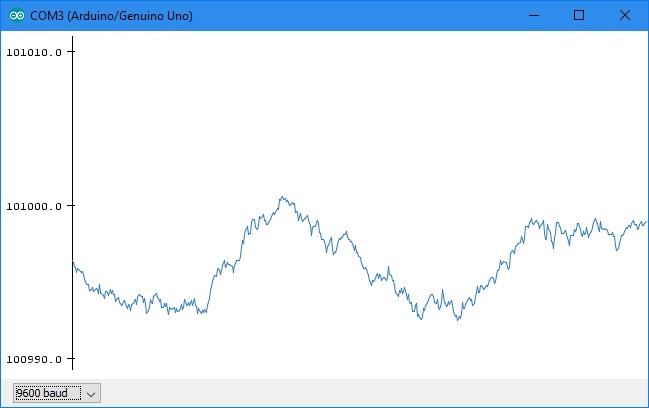
Try a lower value for the filter constant, say 0.02 instead of 0.1, and see the difference. The data is smoother but with a slower response. This is a compromise that has to be sought when using this simple filter. The characteristic is the same as a RC (resistance and capacitance) filter extensively used in electronic circuits.
Make It Standalone
Now we will add a LCD Keypad shield, convert the pressure to height in meters, and show it on the display. We will also add the ability to zero the value by pressing the keypad ‘Select’ button.
With the LCD shield on the Arduino the sensor will have to be connected to the LCD shield. Unfortunately the LCD shields usually come without the appropriate sockets. So the options are to make solder connections or to get some socket strip. Socket strip is available on ebay for not much more than the cost of postage. Do a search on ‘2.54mm socket strip’ and look for ones that are similar to the ones on the Arduino. These usually come in 36 or 40 pin lengths. I would avoid the turned pin ones as they are not deep enough for standard Dupont leads.
The socket strip has to be cut to length and the cut has to be made in the same place as a pin. So for a 6 pin strip – remove the 7th pin with some fine pliers, then cut at that place using a junior hacksaw. I file the ends to make them neat.
Make sure there are no solder bridges when soldering them onto the board.
With the appropriate decision on connecting the sensor plug the LCD shield onto the Arduino and connect the sensor the same pins – but now on the LCD shield.
Also get the battery and lead ready. I made up my lead from parts in my scrap bin but they are also available on ebay – including a nice option that includes a battery box and switch. Search on ‘PP3 2.1mm lead’.
The current consumption is around 80ma. Hence if you want to run for more than a few minutes consider a bigger 9v battery than the PP3.
Add Code for Altitude and the LCD
We need to do a little more coding to convert the pressure to height and drive the display.
At the start of the sketch add the display library and tell this what pins are used:
#include <LiquidCrystal.h>
// initialize the library with the numbers of the interface pins
LiquidCrystal lcd(8, 9, 4, 5, 6, 7);
Next we need some variables and a function to read the keypad buttons. These are all connected to analogue input A0. Each button gives a different voltage to A0. A search on ‘arduino lcd shield buttons code’ found some good code at:
https://www.dfrobot.com/wiki/index.php/Arduino_LCD_KeyPad_Shield_(SKU:_DFR0009)#Sample_Code
Add this code before setup():
// define some values used by the panel and buttons
int lcd_key     = 0;
int adc_key_in  = 0;
#define btnRIGHT  0
#define btnUP     1
#define btnDOWN   2
#define btnLEFT   3
#define btnSELECT 4
#define btnNONE   5
// read the buttons
int read_LCD_buttons()
{
 adc_key_in = analogRead(0);      // read the value from the sensor
 // my buttons when read are centered at these valies: 0, 144, 329, 504, 741
 // we add approx 50 to those values and check to see if we are close
 if (adc_key_in > 1000) return btnNONE; // We make this the 1st option for speed reasons since it will be the most likely result
 if (adc_key_in < 50)   return btnRIGHT;
 if (adc_key_in < 250)  return btnUP;
 if (adc_key_in < 450)  return btnDOWN;
 if (adc_key_in < 650)  return btnLEFT;
 if (adc_key_in < 850)  return btnSELECT;
 return btnNONE;  // when all others fail, return this...
}
Altitude is usually zeroed at the starting point. So we need variables for both height and reference. Add these before setup() and the function above:
float mtr;
float ref = 0;
The conversion from pressure in Pascals to meters is almost exactly a division by 12 at sea level. This formula is fine for most ground based measurements. There are more accurate formulae that are more appropriate for conversion at high altitudes. Use these if you are going to use this to record the altitude of a balloon flight.
The reference should be set to the first pressure reading so we start at zero height and when the SELECT button is pressed. Add, after the filter code, and before the Serial.println statement:
  if(ref == 0){
    ref = filtered/12.0;
  }
  if(read_LCD_buttons() == btnSELECT) {
    ref = filtered/12.0;
  }
After this add the height calculation:
mtr = ref - filtered/12.0;
Lastly change the Serial.println statement to send ‘mtr’ instead of ‘filtered’, and add code to send ‘mtr’ to the LCD:
  Serial.println(mtr);   // Send pressure via serial (UART)
  lcd.setCursor(0,1);         // line 2
  lcd.print(mtr);
All the changes here are included in the example MS5611data2lcd in the .zip file. Load this as in step 2.
There is one last mod that is helpful. The display is difficult to read when it is being updated 60 times a second. Our filter is smoothing the data with a time constant around 0.8s. So updating the display every 0.3s seems plenty enough.
So add a counter after all the other variable definitions at the start of the sketch (e.g. after float ref=0;):
int i = 0;
Then add code to increment 'i' and an 'if' statement to run when it gets to 20 and then set it back to zero and move the Serial and lcd commands within the 'if' statement so these are only executed every 20th reading:
  i += 1;
  if(i>=20) {
  Serial.println(mtr); // Send pressure via serial (UART)
  lcd.setCursor(0,1);         // line 2
  lcd.print(mtr);
  i = 0;
  }
I did not include an example with this last modification in order to encourage entering the code manually which aids learning.
This project should give a good starting point for example for a digital barometer. For those who might want to consider use in RC models - search for OpenXvario for code that enables an altimeter and variometer for Frsky and Turnigy 9x telemetry systems.